
Compare model price and intelligence on one graph
Click the Models heading on a provider page to see every model plotted by coding intelligence against what a coding session costs.
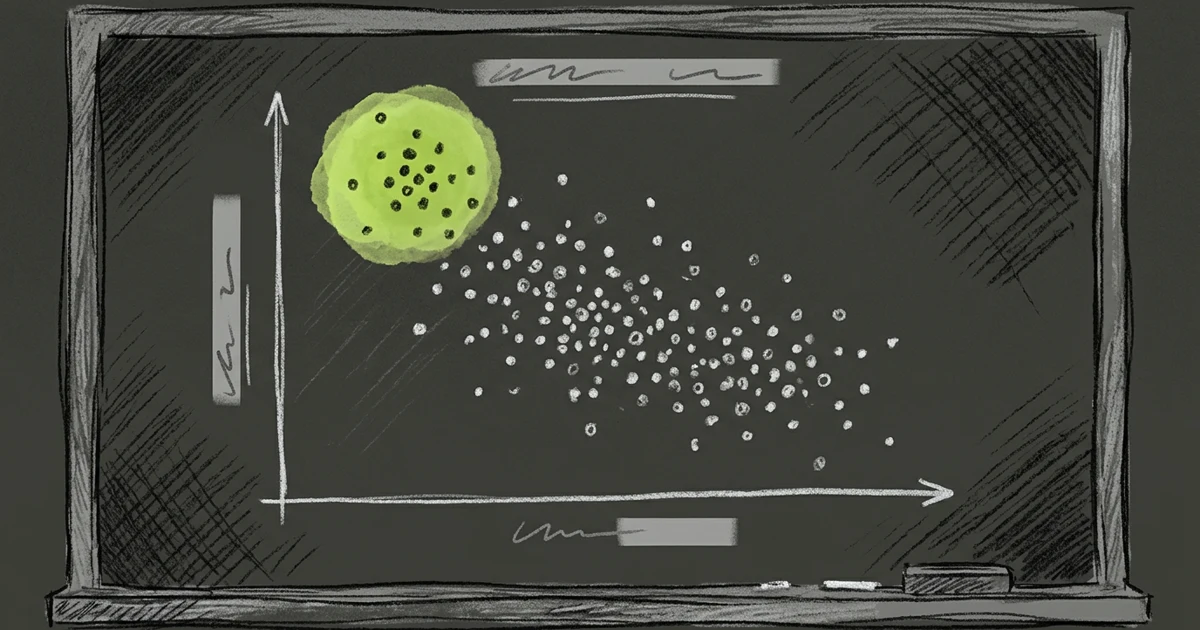
A provider with sixty models gives you a long table of prices and no quick way to see which model earns its price. Tarsk now draws that table as a graph: coding intelligence up the side, price along the bottom, one dot per model.
Open the graph
- Open Settings, then Providers, and pick a provider.
- Click the Models heading above the model table.
The graph replaces the provider page. The close button in the top right takes you back to the table.
Each dot carries the model name. The legend splits the dots in two colours: Enabled for models you switched on, and Available for the rest. Hover a dot to see its input, output and prompt-cache prices per million tokens.
Read it from the top left
Good value sits high and to the left: a strong coding score at a low price. A model far to the right of a neighbour at the same height costs more for the same result.
Use it to find a cheap model for small chores, such as commit messages and quick edits. Or check whether the expensive model you use every day sits much higher than the next one down. If an Available dot sits above and left of an Enabled one, it beats your pick on both axes.
The price axis uses a square-root scale. Free and cheap models spread out at the left instead of piling up at zero, and the expensive models still fit on the right.
Where the price comes from
A coding agent reads far more than it writes. Each turn sends the project context, the conversation and the tool results back to the model, and gets a short reply. The list price for output tokens says little about your bill.
Tarsk blends the prices to match that pattern:
- 99% of the tokens are input and 1% are output.
- 96% of the input hits the provider’s prompt cache.
- Cached input bills at the catalog’s prompt-cache price. If the catalog has no cache price for a model, Tarsk assumes 10% of the input price, the most common rate.
The note under the graph states the same assumptions, so you can check the arithmetic against your own usage.
Intelligence is the coding benchmark index from the model catalog. A model with no pricing or no benchmark score does not appear on the graph. It stays in the table, where you can still enable it.
Try it
Open the provider you pay for most, click Models, and look for a dot above and to the left of your current default. If you find one, enable it in the table and give it your next task.
- The graph shows coding score against the cost of a typical agent session.
- The Enabled colour puts your current choices next to the alternatives.
- Hover any dot for the raw input, output and cache prices.