
Charts, tables and forms inside the chat
Tarsk can place a chart, a table, metric cards or a short form inline in a conversation. It draws them from structured data, not HTML.
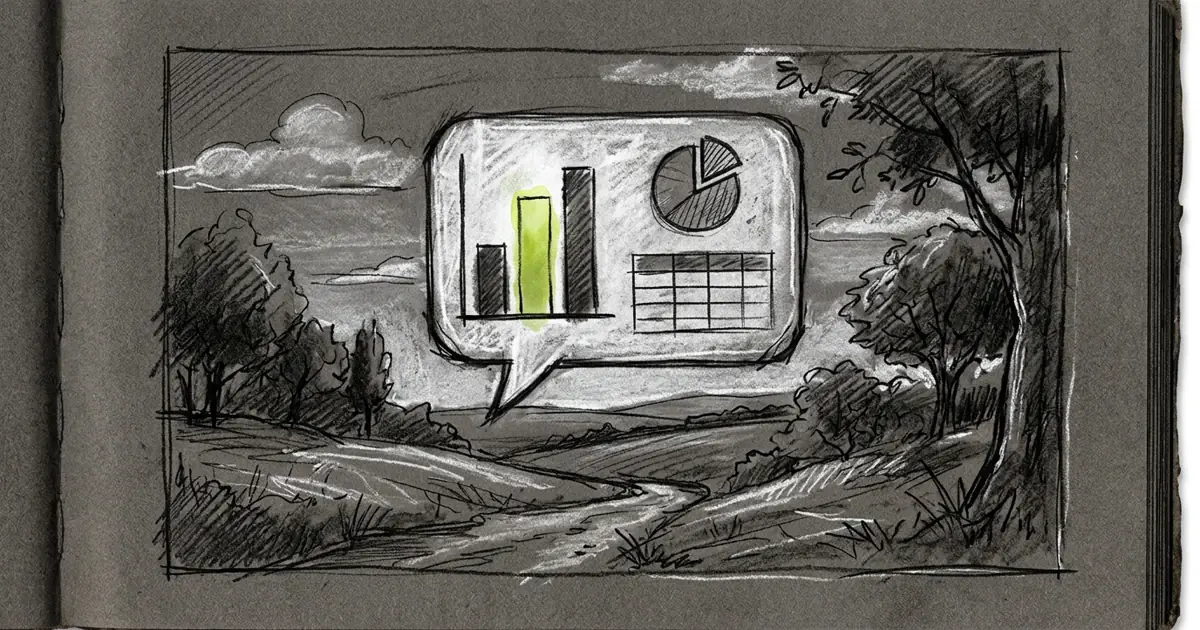
You ask how three packages compare on build time and get a paragraph of numbers. Reading it works. Seeing it takes one glance. Tarsk can put the chart in the answer, along with tables, metric cards and short forms.
Numbers deserve a shape
Most answers belong in prose. Some do not. A comparison across five services, a run of daily counts, a checklist of settings: these read slowly as sentences and quickly as a picture.
The old options were both awkward. Paste a screenshot and the data stops being selectable. Ask for a custom page and you get a one-off artifact that lives beside the conversation instead of in it.
Inline visualizations sit in the chat stream, at the point where the agent produced them. Scroll back a week later and the chart is still there, drawn from the same stored data.
Four shapes
The agent picks one shape per call, from a fixed set.
Charts. Bar, line, area and pie. A bar, line or area chart takes one label column and up to four numeric series, with up to 100 rows. A pie takes a label and a value, with up to 20 slices.
Tables. Up to twelve columns and 100 rows. Good for a short list where each row has several attributes: model, price, context window, and so on.
Metric cards. One to four cards, each with a label, a large value and an optional detail line. Useful for a headline number with its qualifier underneath, such as a test count with the runtime beside it.
Forms. Up to twelve fields: text, number, select or checkbox. A form collects answers to a bounded question, such as which environment to deploy to or how many rows to keep. It does not run anything.
Every shape has a title, and every value is a plain string, number, boolean or null. You will not see a nested object or a chart drawn from a script.
A worked example
Ask for a comparison of test timings and the agent calls the visualization tool once. The call looks like this:
{
  "type": "chart",
  "chartType": "bar",
  "title": "Test suite time by package",
  "xKey": "package",
  "series": [{ "key": "seconds", "label": "Seconds" }],
  "data": [
    { "package": "shared", "seconds": 12 },
    { "package": "app", "seconds": 48 },
    { "package": "cli", "seconds": 31 }
  ]
}
The chat draws a titled bar chart with three bars. The agent gets back one short line, “Visualization presented inline.”, and writes its answer around the chart instead of repeating the numbers underneath it.
One call carries one block. Three visuals in one answer means three calls, and each one lands where the agent made it.
A typed block or a Design
Tarsk also has Designs: self-contained HTML pages the agent writes and previews in a sandboxed frame. They cover layouts the fixed shapes cannot.
Pick a typed block when the data fits a chart, table, card or short form. Tarsk draws it, so it stays consistent with the rest of the interface, respects your theme and cannot run code.
Pick a Design when the layout carries meaning: a dashboard with a specific arrangement, a mock of a screen you plan to build, a report with its own visual language. A published Design may run scripts inside its sandbox, with no network access and no access to the app around it.
When you submit a form
A form field collects a value and the submit button sends those values back as a user message. The message records which form produced it, which button you pressed and every value you entered.
That message starts a normal agent turn. The form cannot call a tool by itself, and the agent still follows the usual rules for confirming actions.
Where they appear
Visuals render in the chat transcript in the desktop and web app, and in the Capacitor mobile build. The native iOS client shows the tool call as activity and does not draw the block yet.
A few hard limits keep rendering predictable:
- 100 rows for a table or a cartesian chart, 20 slices for a pie.
- Four series on a chart, four metric cards, twelve columns, twelve form fields.
- Titles up to 240 characters, values up to 500.
- 24 KB for the whole payload. Tarsk rejects a larger payload, and a malformed one shows “This visualization could not be displayed.”
If a visual comes back blank, ask for it again with fewer rows or fewer series. The data usually outgrew the shape.
Try it
Next time you need a comparison, ask for the chart directly: “show the last five runs as a bar chart” or “put the prices in a table”. The agent grounds the data in what it already read, and the answer arrives with a picture in it.
- Charts, tables, metric cards and forms render inline, from structured data.
- A typed block cannot run code. A Design can, inside a sandbox.
- Forms send your answers as a message. They do not act on their own.
Open a chat and ask for a chart of something you have been reading as a list.