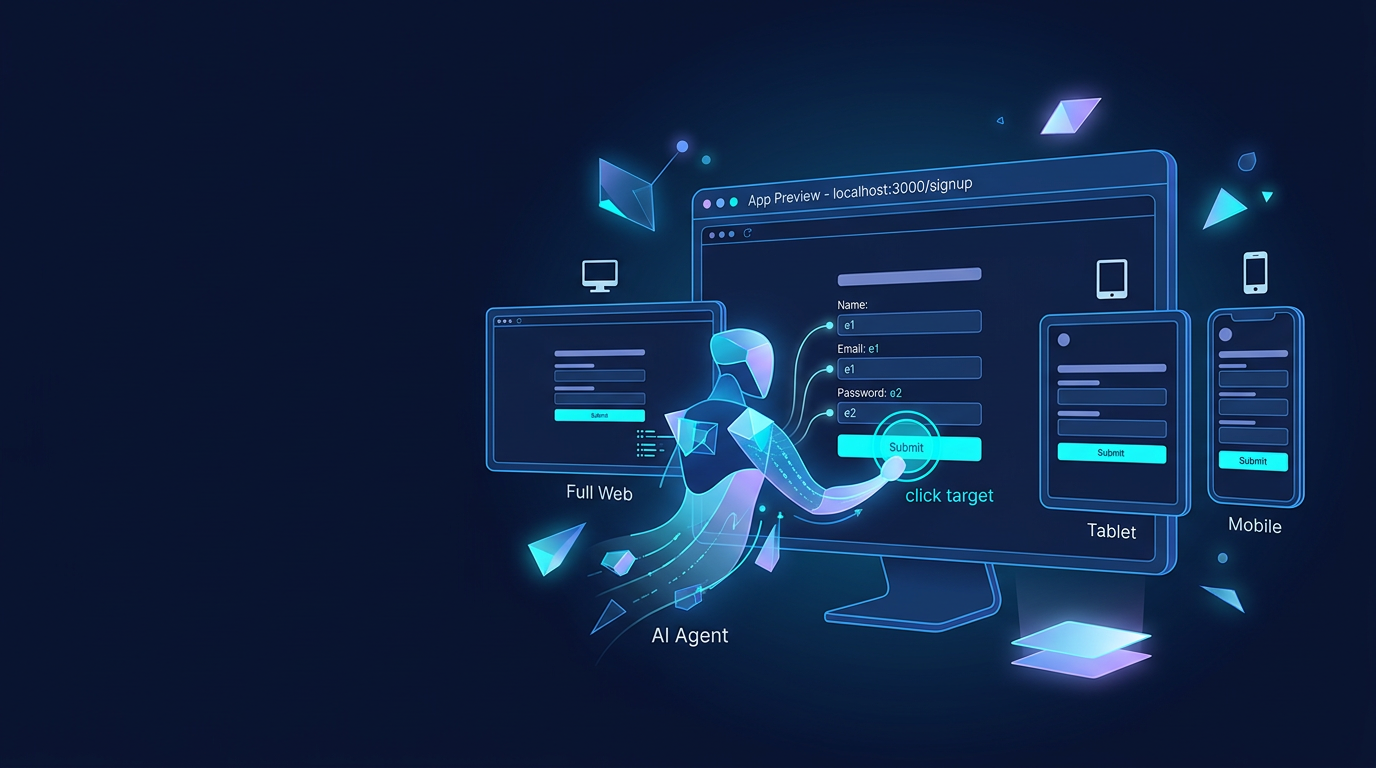
Agent browser automation lets Tarsk work inside your running app instead of guessing from code alone. Start your dev server, open the Browser tab, and the agent can inspect the page, switch viewport presets, click buttons, fill forms, wait for UI changes, and capture screenshots without leaving the app.
This guide shows the full workflow in Tarsk: dev server to Browser tab to agent-driven testing. It also explains the part that matters most up front: the Browser tab exists across platforms, but agent browser automation only works in the desktop app.
What problem this solves
If you build UI with an agent, you usually bounce between three places: the editor, the chat, and a separate browser window. That works, but it slows down every small loop. You ask for a change, wait for the edit, alt-tab to the browser, refresh, inspect the result, then describe the next issue.
Tarsk closes that loop inside the thread. The Browser tab gives you an in-app preview of your app, and the agent can act on that preview directly. It can open a URL, take a page snapshot, identify visible elements, click or fill those elements, switch to tablet or mobile view, read console logs, and save a screenshot for review.
That makes a big difference for frontend work, localhost testing, and quick regression checks after a code change.
Requirements and setup
Before you use agent browser automation, make sure these pieces are in place.
Use the desktop app
Agent browser automation is currently available in the desktop app.
You can still use the Browser tab as a manual preview elsewhere, but the agent actions that open URLs, inspect the page, click elements, fill forms, and take screenshots require the desktop app.
Set a Run Command for your project
Open your project settings and add the command that starts your dev server.
Examples:
bun dev
npm run dev
pnpm dev
python manage.py runserver
Tarsk uses that command for the thread’s Run/Stop button.
Start the dev server first
Click Run before you ask the agent to test a localhost app.
Tarsk detects common dev server URLs from process output, including localhost:3000, 127.0.0.1:5173, and similar local addresses. When it finds one, the Browser tab can preload that URL for you.
If your app runs on another address or port, you can still type the URL into the Browser tab manually.
Open your app in the Browser tab
Once the dev server is running, click the Browser tab in the thread.
The Browser tab includes:
- an address bar
- a refresh button
- viewport buttons for desktop, tablet, and mobile
- an open-external button for your system browser
If Tarsk already found the dev server URL, the tab fills it in for you. If not, enter the address yourself. Tarsk normalizes plain hosts to http://..., so localhost:3000 becomes http://localhost:3000.
If you are using the desktop app, the page opens in the Browser tab and is ready for the agent to use. In other environments, you can still preview the page manually, but agent automation remains desktop-only.
Ask the agent to use the browser tool
Once the page is open, ask the agent to test or inspect it in the Browser tab.
Good prompts are concrete about the page, the goal, and the expected result.
Examples:
- “Use the browser tool on my running app, switch to mobile viewport, and tell me whether the nav collapses correctly.”
- “Open the signup page in the Browser tab, fill the form with test data, submit it, and wait for the success message.”
- “Take a snapshot of the settings page, click the billing tab, and capture a screenshot of the loaded state.”
- “Reproduce the dashboard filter bug in the Browser tab, collect console errors, and tell me what failed.”
When the agent starts a browser action, Tarsk switches to the Browser tab automatically, runs the action on the open page, and can switch back to Chat when the interaction finishes.
That automatic tab switch is part of the feature, not a glitch.
Understand the core workflow
The easiest way to understand agent browser automation is to think in one loop:
- Start the dev server.
- Open the Browser tab.
- Let the agent inspect the page.
- Let the agent interact with visible elements.
- Review the result in the same thread.
This is the flow Tarsk uses behind the scenes:
flowchart LR
  A[Start dev server] --> B[Browser tab gets localhost URL]
  B --> C[Agent calls browser tool]
  C --> D[Tarsk switches to Browser tab]
  D --> E[Preview is ready]
  E --> F[Agent runs snapshot click fill wait for screenshot]
  F --> G[You review result in Browser tab or chat output]
Recent updates made this loop much smoother, especially around viewport changes, screenshots, and moving between Browser and Chat during automation.
Use snapshots to find elements before you click
A snapshot is the most useful place to start.
It gives the agent a structured view of what is currently visible on the page so it can target the right button, input, or link in the next step.
That matters because the agent is working from the current page state, not guessing where something might be on screen.
A typical prompt looks like this:
Take a snapshot of the current page and click the Sign in button.A typical sequence looks like this:
- take a snapshot
- identify the Sign in button
- click it
If the page changes after a click, ask the agent to snapshot again so it can work from the latest state.
Switch viewport presets during testing
The Browser tab supports three viewport presets:
- desktop
- tablet
- mobile
The agent can switch presets, and the Browser tab updates the preview size to match.
That makes responsive checks much easier when you are working on:
- nav menus
- mobile drawers
- stacked layouts
- form spacing
- dashboard cards
For example:
Use the browser tool to switch to mobile viewport, open the user menu, and tell me whether the drawer content overflows.That makes viewport changes feel like part of the same workflow instead of a separate manual step.
Click, fill, press, hover, and wait for changes
Once the agent has refs from a snapshot, it can interact with the page.
The main actions are:
- click
- fill
- hover
- press keys
- wait for a page change
This covers most UI testing flows inside a localhost app.
A simple form test usually looks like this:
- open the page
- take a snapshot
- fill the email field
- fill the password field
- click submit
- wait for success text or a selector
Example prompt:
Open the signup page, fill the form with a test email and password, submit it, and wait for the dashboard heading.The agent can also press keys such as Enter, Escape, or Tab, which helps with keyboard flows and dialogs.
wait_for is important because it gives the page time to render the next state instead of forcing the agent to race the UI.
Read console logs and run page JavaScript
Sometimes a page looks fine, but the real problem shows up in the console or in page state.
Two useful inspection options help with that:
- reading console logs
- checking values on the page with JavaScript
Use console logs when you want the agent to look for runtime errors, warnings, or rejected promises in the preview page.
Use page JavaScript when you want the agent to inspect values that live in the DOM or the browser environment.
Example prompts:
- “Open the dashboard, reproduce the filter bug, and collect recent console errors.”
- “Evaluate JavaScript in the current page and tell me whether the feature flag is present on
window.”
This is a good fit for frontend bugs where the code change succeeded but the app still breaks at runtime.
Capture screenshots for review
Use screenshot when you want a visual artifact of the Browser tab state.
That works well for:
- before and after checks
- regression review
- UI handoff in the thread
- confirming a loaded modal, page, or empty state
Screenshots appear as normal image output in the thread, which makes them much easier to review and share during a task.
On macOS, screenshots may require Screen & System Audio Recording permission. If Tarsk cannot capture the Browser tab preview, grant that permission in Settings, restart the app, and try again.
For large third-party pages or cross-origin content, screenshot fallback can still fail. The best use case is your own localhost app in the in-app preview.
Walk through a full localhost testing flow
Here is a practical end-to-end workflow for a frontend task.
Step 1: Start your dev server
Set the project Run Command, then click Run.
Wait until the output shows your local URL, such as http://localhost:3000 or http://localhost:5173.
Step 2: Open the Browser tab
Click Browser and confirm that your app loads.
If the URL did not auto-fill, type it into the address bar and press Enter.
Step 3: Ask the agent for a concrete browser task
Use a prompt like this:
Use the browser tool on my running app. Switch to mobile viewport, open the signup page, fill the form with test data, submit it, wait for the success state, and take a screenshot.Step 4: Let the agent inspect the page first
The agent will usually start with snapshot so it can get refs for the current page state.
That gives it the visible buttons, inputs, and links it can act on.
Step 5: Let the agent perform interactions
The agent can then:
- click navigation links
- fill inputs
- press keys
- wait for the next screen
- re-snapshot after the UI changes
Step 6: Review the output
You can inspect the result in two places:
- the Browser tab itself
- the tool output in chat, including screenshots when captured
If the agent finds a problem, ask it to fix the code and run the same browser flow again.
That keeps the edit-test-review loop inside one thread.
What to expect in the UI
A few Browser tool behaviors are worth knowing before you use the feature heavily.
The Browser tab may open by itself
When the agent starts a browser action, Tarsk switches to the Browser tab so it can attach the action to the active preview webview.
Tarsk can switch back to Chat
If the browser task started from Chat, Tarsk can return you there after the interaction finishes. If the agent needs your input mid-run, it can also bring you back to Chat so you can answer.
The preview keeps its state across tab switches
The Browser tab preserves the loaded page while you move between Browser, Chat, Explorer, and other tabs. That makes it useful for multi-step debugging and UI review.
Common pitfalls
Most browser-tool failures come from a small set of issues.
Trying to use automation outside the desktop app
The Browser tab preview can exist outside desktop. Agent browser automation cannot.
If you want the agent to open URLs, click elements, fill forms, or take screenshots in the Browser tab, run Tarsk in the desktop app.
Forgetting to start the dev server
If you ask the agent to test a localhost app before the server is running, there may be no page to load.
Start the dev server first. Then confirm the Browser tab has the correct URL.
Reusing old snapshot refs after the page changes
Snapshots describe the current page state. After navigation or a UI update, ask the agent to snapshot again before it continues.
Expecting full DevTools behavior
The Browser tab is for preview and in-app automation. Use your system browser when you need full DevTools, network inspection, or a broader external-site debugging workflow.
Screenshot permission issues on macOS
If screenshot capture fails, check Screen & System Audio Recording permission in Tarsk settings, then restart the app.
Summary
Agent browser automation gives Tarsk a direct loop into your running app. Start the dev server, open the Browser tab, and let the agent inspect the page, switch viewport presets, click controls, fill forms, wait for UI changes, read console logs, and capture screenshots from the same thread.
Use it when you want fast localhost testing and UI verification without jumping out to a separate browser window. If you work in the desktop app, this is one of the fastest ways to move from code change to visible proof.